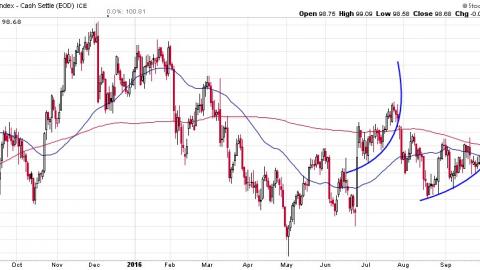
CNBC headline story of the day..."Dollar forms bullish 'golden cross' - here's how to trade it"
The article explains how whenever a 50 day moving average of an index's price crosses over the 200 day moving average, it's a signal the index is going to move further in the direction of the cross. On this chart, we have the 50 day crossing over the 200 day three times prior to yesterday's cross over. And how did this "can't miss" signal do? Well, it's 0 for 3. Last October, the 50 day crossed under the 200 which should be a sell according to this analysis. And the cross indicator could not have been more wrong. It provided a sell signal almost to the day of the low in the index before it screamed 7% higher in just over a month.
Then it gave a bullish signal in mid-November only to have the index reverse sharply a couple of weeks later. So now this can't miss indicator is 0-2. The bearish cross this past April did signal lower prices to come but only well after half the move took place. If you're "system" was to wait for another cross before reversing the position, you would have lost money when you reversed it this week. That's an 0-3 count. So to sum it all up, this "golden cross" indicator appears to be a bunch of malarkey.
So trade this cross as you will but I expect when the mini-parabolic curve I have drawn breaks down, then it will be time to sell the USD. Here's my checklist:
- Heavily overbought: Yes (RSI over 70)
- Series of lower highs and lower lows on the weekly chart: Yes
- Financial Media as a contrarian indicator: Absolutely. Whenever Goldman Sach's minions start pumping something up, we know its time to fade whatever trade they're recommending.
