Performance Report: 08/31/2023
All performance data for our strategies is net of all fees and expenses. All performance data for indexes or other securities is from sources we believe to be reliable. All data is as of 08/31/2023.
Investment Strategy
MAP: Full ($500k+)
MAP: Mini
MAP: ETP (<150k)
S&P 500 Index2
Balanced (AOM)2
Global Balanced2
Aug Return
(1.3%)
(1.0%)
(1.4%)
(1.8%)
(1.4%)
(1.5%)
YTD
7.5%
4.4%
2.0%
17.4%
6.6%
8.8%
Inception1
38.7%
32.5%
26.0%
53.0%
14.2%
25.2%
VORR3
.903
.747
.578
.604
.295
NA
In August, we saw a slight decline, but we still managed to outperform our benchmarks and protected YTD gains. In last month's update, I wrote:
I started to pull back on all our exposure in both equities and hard assets. I did this in part to lock in gains and in part because I see a level of exhaustion in equity indexes that needs to be resolved. The S&P 500 hasn't experienced a true down week since the end of February (A "true down week" is when the index closes lower than the low of the prior week). All equity indexes are strenuously overbought.
Pulling back on our exposure proved wise. Between Febuary and July, the S&P 500 did not have a weekly close below the prior week's low. In August, it did so twice. A decline in the first half of August precipitated a V-shaped recovery in the back half of the month. A behavior the S&P 500 has exhibited time and again since QE started in late 2010. The S&P 500 closed the month modestly down. Bonds performed in kind experiencing a large drop in the first half of the month then recovering the majority of their losses over the past two weeks. TLT, the largest long-term US Treasury Bond Fund, fell nearly 4% in the early part of August before recovering half of its losses. Corporates including Junk Bonds have held up better ending the month essentially flat.
Despite pulling back on my exposure, and eliminating all positions that should have a strong correlation with the S&P 500, my strategy maintained a moderate level of correlation wtih the S&P 500 anyway. My Full-size Strategy was 61% correlated with the S&P despite not holding a single S&P 500 component. Becoming as defenisve as I did certainly helped but it wasn't quite enough to protect us from a mild loss for the month.
Market Update
The August decline in equity prices didn't impact the technical strength of the markets in a meanginful way. On the bearish side, financials and small-caps underperformed the broader S&P 500. But this underperformance could easily be chalked up to the idea that these indexes are naturally more volatile. There was not a performance divergence that was sufficient enough to tip the scales more bearish.
Junk bonds have continued to defy all odds. HYG, the largest junk bond ETF, experienced a mild gain in August despite both equities and risk-free bonds declining in value. I have no idea who is happily buying junk bonds yielding 6% when they can get 5.25% risk-free but somebody apparently is. This behavior is likely the result of the greater fool seeking to squeeze out the last cent of yield that he can. Typically, the late-cycle trades made by the greater fools are the ones that are unwound the quickest so I'm keeping a keen eye on this sector to see how it behaves.
One concerning development for equity investors is the complete lack of leadership in equity markets. The following is an updated chart which I've included in past updates. It represents the number of new 52-week highs which, historically, has been a strong indicator of where markets are headed. A high number indicates a healthly rally where as a low number can signify potential weakness. A low participation rate has preceded every bear market on record.
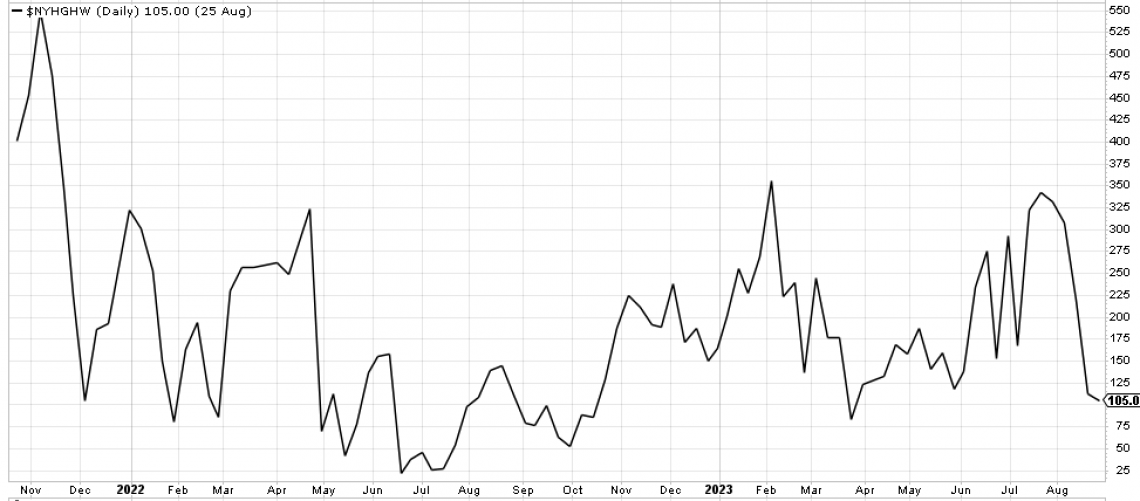
It's ominous that the number of stocks hitting 52-week highs didn't budge in the latter half of August given the S&P 500 experienced a strong rally and closed just 2% below its 52-week high, It's still too early to tell how meaningful this is but a development to watch closely. If the S&P continues higher then new highs should see a significant uptick. But if the S&P declines, then it may be time to get even more defensive.
Conclusion
I think it's worth noting that we are entering the most perilous seasonal period for stocks. If bad things happen, they tend to happen in September and October. I always get a kick out of studies completed by my industry that quote the long-term harm that is done if "an investor misses the 10 best days of the market." What these studies fail to point out is the 10 best days invariably come right after the 10 worst days.
In a world that is experiencing unprecedented monetary inflation, it's important to maintain some exposure but I believe staying clear of high-beta, cyclical stocks is a prudent strategy for the time being. I will continue to provide exposure to securities that support my thesis but will only emphasize those that should have little correlation to the S&P 500.
As always, please do not hesitate to call me at 512-553-5151 if I can be of assistance.
Best,
Matt McCracken
1) Inception date of 4/30/2019
2) All benchmark prices are obtained through the Yahoo!Finance website. S&P 500 Index is calculated using the index price. AOM is the iShares Core Moderate Allocation ETF. Global Balanced is calculated using a 40% allocation to the S&P 500, a 40% allocation to BND, and a 20% allocation to IEFA.
3) VORR is our "Value over Risk Ratio": Calculated by taking the total return divided by the sum total of all negative months. Ideally, the ratio represents how much loss an investor has to endure to get X gain. A negative RORR score implies there is more risk in the investment than return.