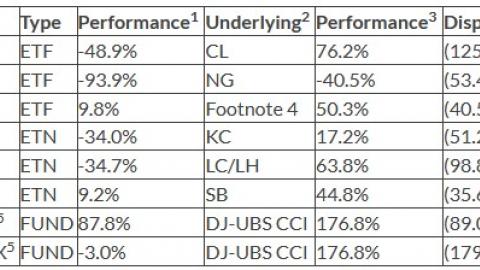
The strong performance of commodities since the end of the tech bubble has attracted quite a lot of interest and assets under management to the space. Prior to 1999, there were virtually no public funds trading commodity futures on US exchanges (QRAAX went public in 1997 and that was all). After the “Tech Wreck”, commodities outpaced stocks and bonds, so money was attracted to the space and thus retail solutions were created. Unfortunately, these funds have failed in epic fashion to keep pace with the price of the underlying commodities. The following is a table outlining their performance, or lack thereof:
| Fund | Type | Performance1 | Underlying2 | Performance3 | Dispersion |
|---|---|---|---|---|---|
| USO | ETF | -48.9% | CL | 76.2% | (125.1%) |
| UNG | ETF | -93.9% | NG | -40.5% | (53.4%) |
| DBA | ETF | 9.8% | Footnote 4 | 50.3% | (40.5%) |
| JO | ETN | -34.0% | KC | 17.2% | (51.2%) |
| COW | ETN | -34.7% | LC/LH | 63.8% | (98.8%) |
| SGG | ETN | 9.2% | SB | 44.8% | (35.6%) |
| PCRIX5 | FUND | 87.8% | DJ-UBS CCI | 176.8% | (89.0%) |
| QRAAX5 | FUND | -3.0% | DJ-UBS CCI | 176.8% | (179.8%) |
1. Performance for the fund is from IPO through 6/30/2014. For the same period, we measured the change in spot price of the underlying commodity starting at the fund's IPO date through 6/30/2014
2. The underlying commodity or index is straightforward for some funds and more obfuscated on others. We choose the best approximation we could arrive at for each.
3. Change in spot price, not the performance of the futures. According to the Yale Study which you can read by clicking on this link, futures have historically outperformed the underlying but we cannot guaratee that has been the case.
4. DBA was originally comprised of 25% of C, S, SB and W. At some point in time, they changed their benchmark and the make up of their portfolio. We contacted the fund's manager and they could not tell us when the change took place or why. For the sake of this comparision, we assumed the fund has always been invested in an equal 25% allocation to C, S, SB and W.
5. Since 12/31/2002 which is the year-end price immediately following PCRIX's IPO.
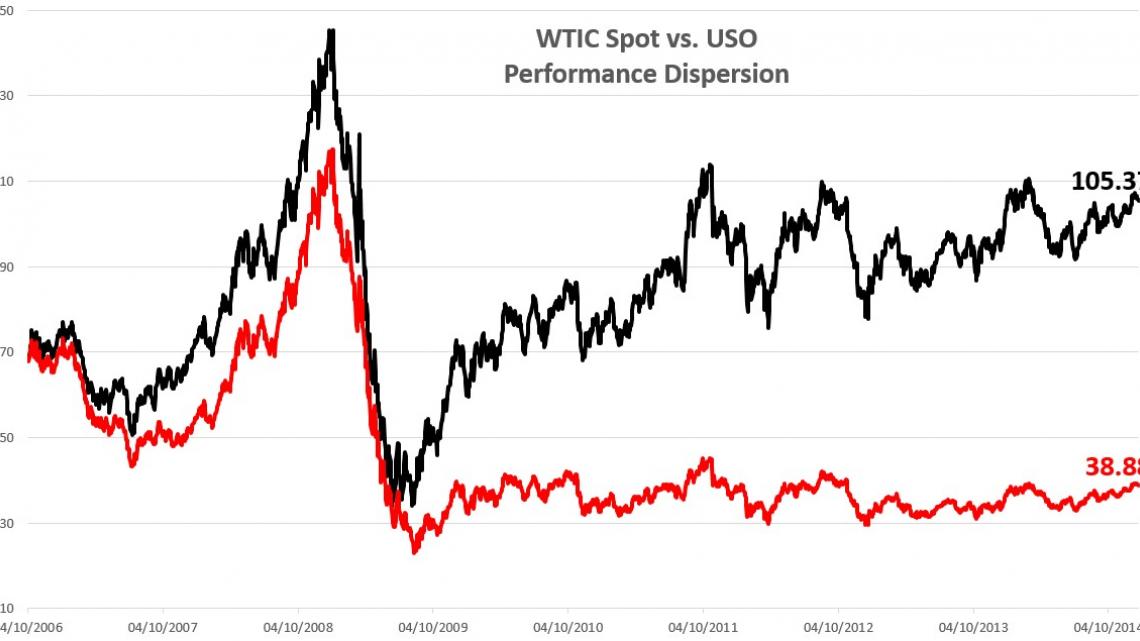
The following is a graphical representation of how just one ETF, USO, has failed in tracking the underlying commodity. The image illustrates how the underperformance has taken place consistently and not due to a one-off event.

This chart clearly illustrates the remarkable underperformance of USO, one of the oldest and largest commodity ETFs. Even while the underlying has appreciated over 50%, the fund lost nearly 50%! (data from 4/10/2006 through 6/30/2014)
WHY?
The obvious question is why do these funds fail in such abysmal fashion? We have our theories. Front-running by institutional investors may be a big part of it. These funds have to constantly roll contracts to "track the index" and this provides a wonderful opportunity for institutional investors to game the funds in their advantage.
Another factor is simply the chore of rolling all their contracts multiple times per year. Imagine if the Vanguard S&P 500 fund had to roll its entire portfolio of stocks several times a year. Since these funds are tracking an index, they have to roll contracts much more often than a managed futures fund which can choose at their own discretion which contracts they will trade.
We have other ideas as well but they are too involved to explain here. In the end, does it matter why they underperform? All that really matters is that retail commodity funds have been a losing proposition since their inception and there are no changes on the horizon to improve the situation. If an investor is interested in participating in the space, then they need to look for a managed futures strategy that will not fall prey to the ills facing retail commodity funds.
If you're in the commodity space through ETFs, ETNs or Mutual Funds and would like to obtain effective commodity exposure, give us a call at 214 | 954 4300 or fill out our Contact Us form.
