Performance Report: 05/31/2025
All performance data for our strategies is net of all fees and expenses. All performance data for indexes or other securities is from sources we believe to be reliable. All data is as of 05/31/2025.
Investment Strategy
MAP: Full ($500k+)
S&P 500 Index2
Mod Alloc(AOM)2
Growth Alloc (AOR)2
May Return
0.9%
6.1%
1.1%
1.2%
YTD
6.5%
0.0%
3.7%
4.4%
Inception1
58.2%
100.0%
35.3%
50.5%
Sortino3
0.83
0.74
0.42
0.55
(Disclosure: We need to compile additional data to report performance on all of our strategies. Currently, we only have continuous data for our full-size MAP Strategy. In future months, we'll report on all our strategies. In the interim, know that the performance of your individual account may vary, but should be correlated to our full-size MAP.)
Performance Update
In May, we experienced mild gains across the board for all strategies. Our cornerstone strategy, the Market Anomaly Program (MAP), appreciated just under 1% and is up nicely YTD, besting all of our benchmarks. Since inception, our strategy has bested our benchmarks by a significant margin, and our risk-adjusted returns are still better than the S&P 500.
For our new clients who are participating in our MAP+ or Balanced model, I'll start providing performance reporting figures for those in next month's update. At this point, there have been so many accounts being recharacterized and moving over that it would be near impossible to accurately calculate performance figures that would be compliant.
Prior to May, our YTD gains had been driven largely by precious metals, but in May those positions were flat to down. However, uranium stocks picked up the slack and were responsible for our modest gains for the month.
Market Commentary
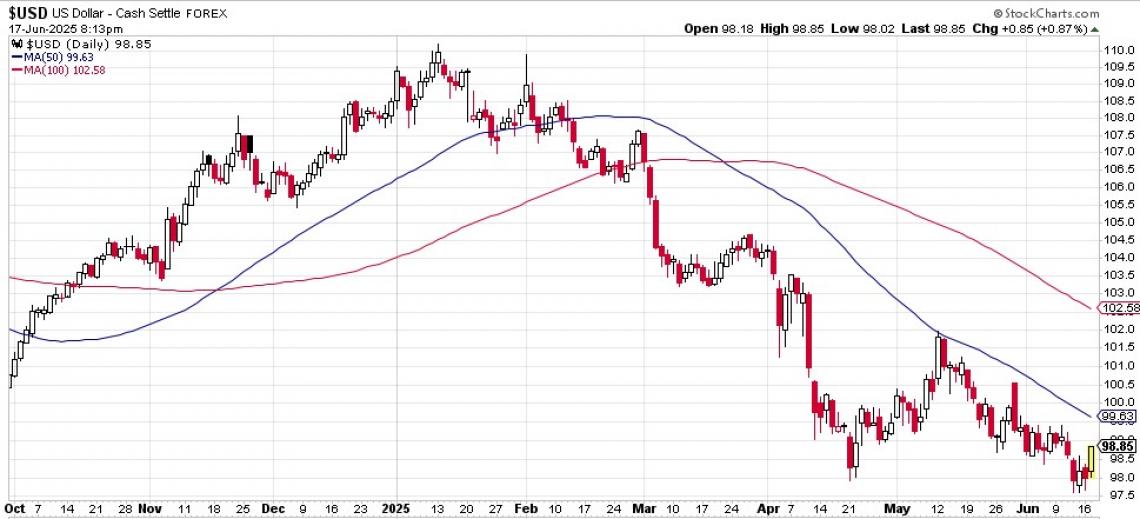
The stock market exploded higher, assisted by continued covert QE from the FED. The FED has been buying US Treasury bonds in bulk to keep rates low to help assist the economy. Despite the FED's best efforts to boost the bond market and fend off the bond vigilantes, it seems there is considerable selling by foreign holders of US sovereign debt. And, the collateral damage has been the USD. While equities are now flat for the year and US Treasury bonds are up slightly, the USD is the primary victim of the tariff wars, seeing a marked decline YTD.

While the tariff scare roiled equity markets in March and April, they have largely recovered their losses. This is a testament to the resilience of Wall Street and the FED (Greenspan) put.

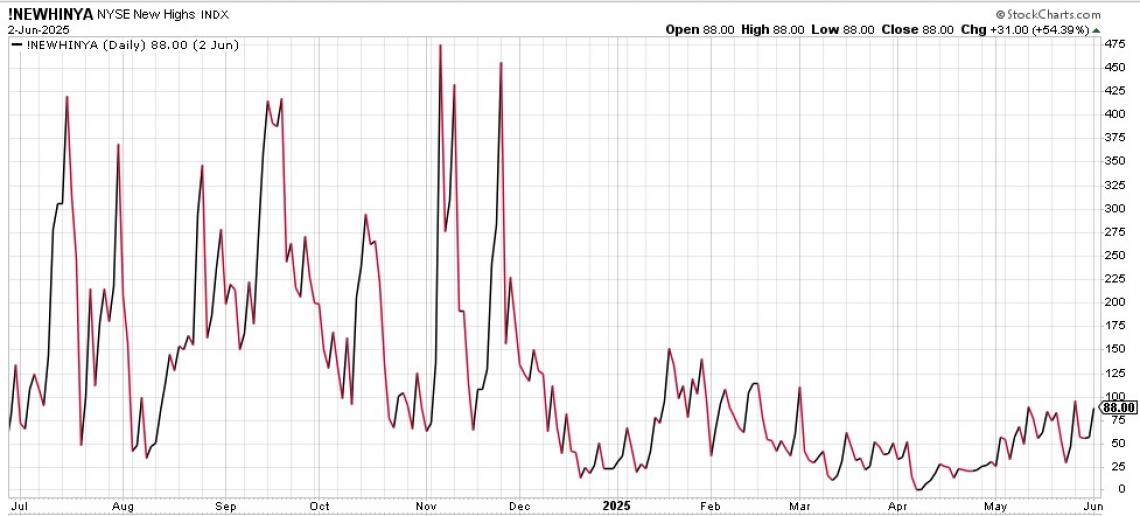
Incredibly, despite the strong move in equities this month, leadership is essentially non-existent. Given the close proximity of the indexes to their all-time highs, a healthy stock market rally should exhibit more individual stocks hitting new highs. That has not been the case the past month. Volume, which I touched on last month, has gone from slightly bearish to decidely bearish. These indicators would suggest more downside risk, but upward momentum is so strong that markets may very well continue higher for a little longer. From a technical standpoint, the market has given us a gift in providing us a couple greatly convenient stop prices, based on the weekly lows from the past month. If those lows are violated—meaning there is daily close below them—then the odds of a significant decline would emerge. But, until then, we'll side with the old adage that "momentum is our friend" and hold firm to our equity market exposure.
Conclusion
Focusing on risk management has served us well this year. Now that the stock market has found its footing, I suspect we'll be adding risk. While there are still considerable risks facing the stock market and our economy, this is nothing new. As long as the FED can continue to pump up the stock and bond markets with easy money, the path of least resistance is up. For that reason, watching the US Dollar and US Treasury market is key to see if the "FED put" may prove to be impotent at some point.
As always, please do not hesitate to call us at 512-553-5151, if we can be of any assistance.
Best,
Matt McCracken
1) Inception date of 4/30/2019
2) All benchmark prices and returns are obtained through IBKR's PortfolioAnalyst reporting tool. S&P 500 Index is calculated using the index price. AOM is the iShares Core 40/60 Moderate Allocation ETF. AOR is the iShares Core 60/40 Balanced Allocation ETF. These benchmarks were chosen as they represent the prevailing investment strategies of retail advisors.
3) The Sortino ratio is a commonly used measure of "alpha" or the value a manager adds to a portfolio. It is similar to the Sharpe ratio. The Sortino ratio does emphasize the negative impact of downside volatility more than the Sharpe ratio which is why we use it as our primary measure of alpha.
